Case study 1 · Public data analysis
Medicare Part D drug spending, 2020 to 2024: what drove the $90.0B increase
Public CMS data, 14,536 rows. I split the growth in gross Part D drug spending, drug by drug, into patients, prescribing volume, price per dosage unit and newly listed drugs, reconciled to the cent.
DuckDB SQL · Python (pandas, matplotlib, Plotly) · pytest · static HTML dashboard
Problem
One headline total hides very different forces: more patients on each drug, more prescriptions per patient, a different spend per dosage unit, and drugs entering the list. The CMS file is also messy. Some beneficiary counts are suppressed for privacy, manufacturer rows sit next to the overall rows and would double-count if summed, and the newest release lists only drugs still on the market, which makes 2020 look smaller than it was.
What I built
- A DuckDB SQL pipeline of 9 ordered scripts that loads two CMS releases, runs data quality checks, and builds the totals, top drugs, drug group growth, concentration and negotiation tables.
- A per-drug LMDI decomposition that splits each of 3,508 brands' change into patients per drug, use per patient (claims per patient and dosage units per claim), spend per dosage unit and newly listed drugs. The parts add back to the total to the cent.
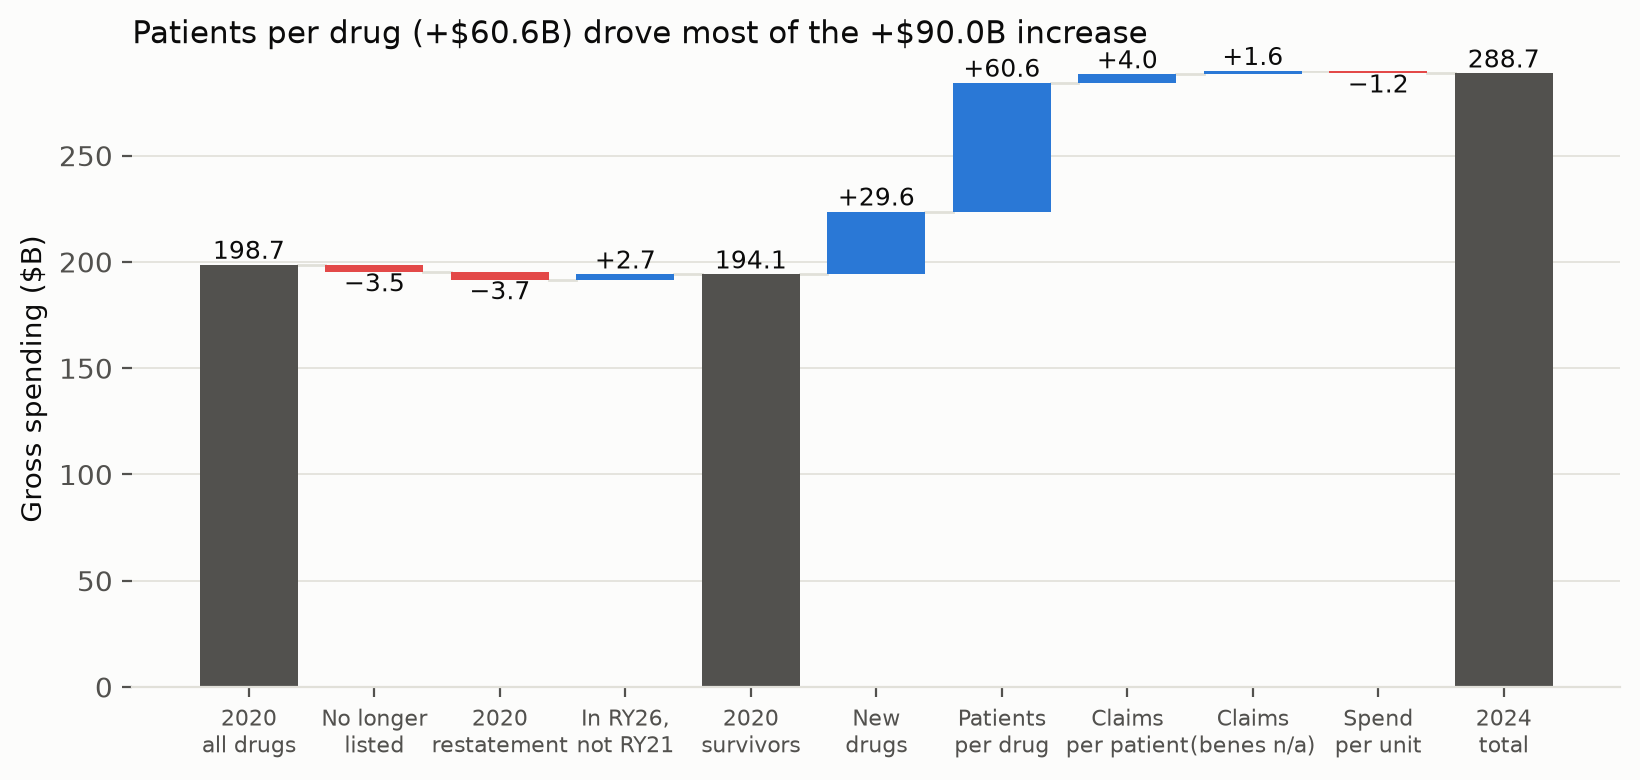
- A correction for the missing 2020 drugs, built from the earlier release, in three labelled steps: brands absent from the new file (−$3.5B), the 2020 restatement (−$3.7B) and brands only in the new file (+$2.7B).
- An interactive one-file dashboard, a one-page management report, and 43 tests that tie every displayed number to a results file.
Results
- Gross Part D drug spending rose $90.0B (+45.3%). The biggest driver was more patients per drug: +$60.6B, 67.3% of the change. Newly listed drugs added +$29.6B; spend per dosage unit took off $1.2B.
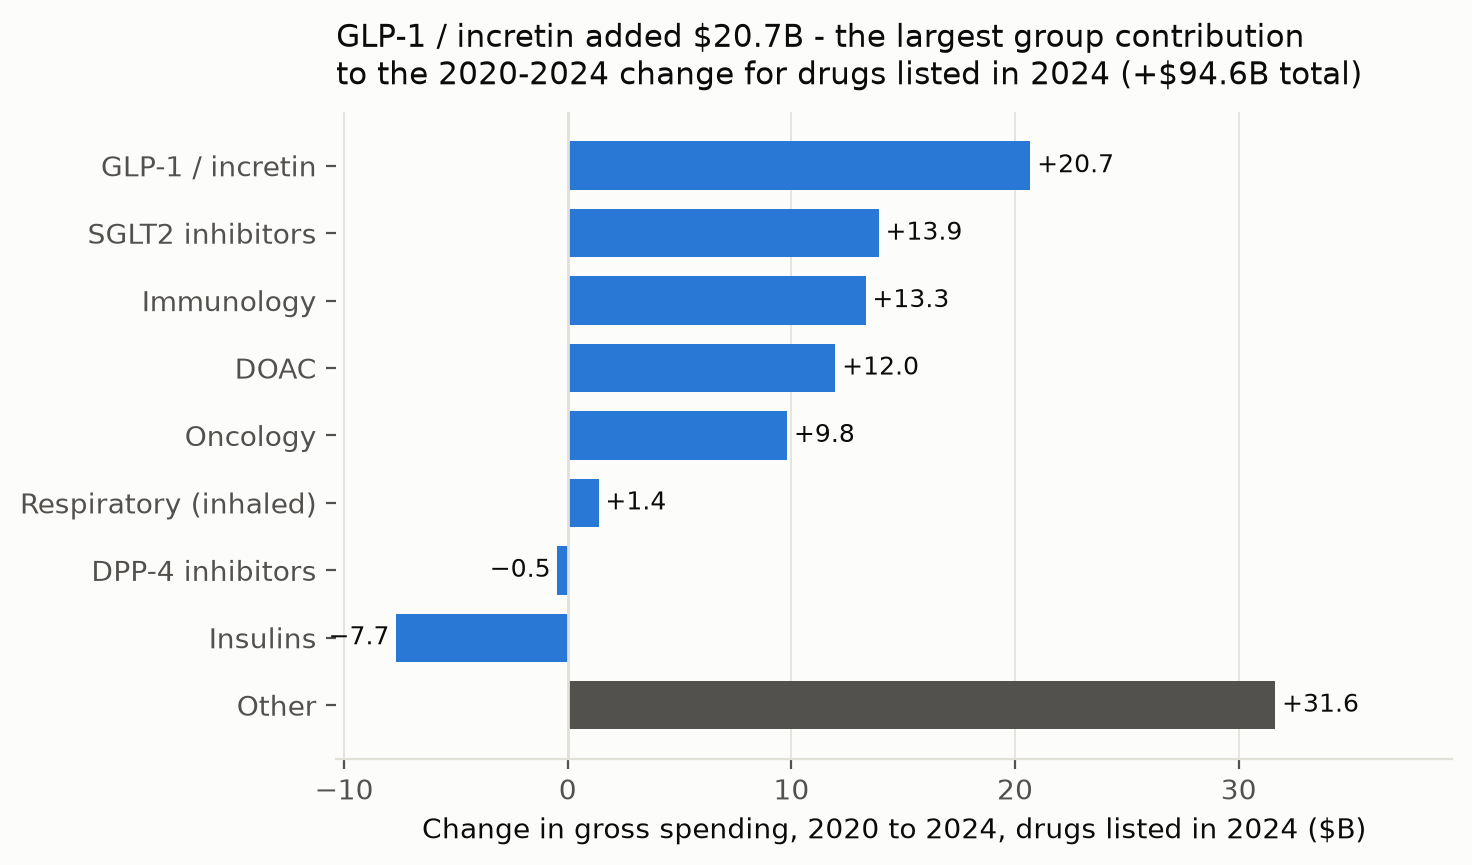
- Growth is concentrated in GLP-1 / incretin drugs (+$20.7B). Insulins fell $7.7B after the $35 cap. Ozempic alone added $11.5B.
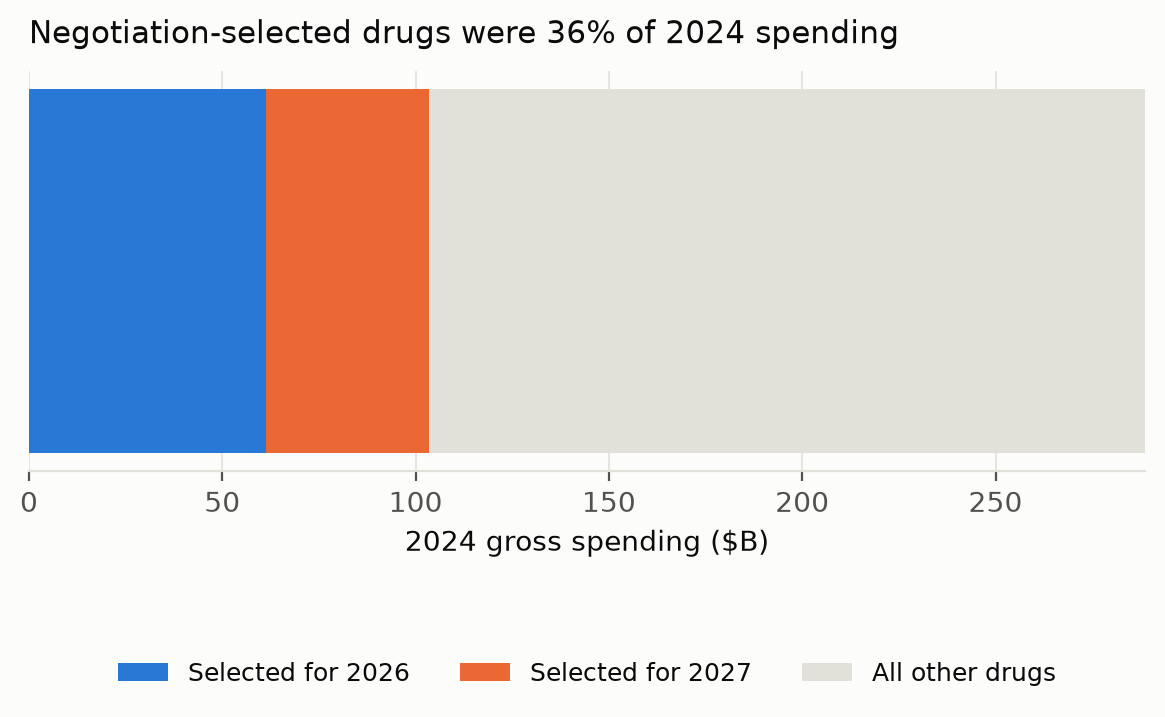
- The 25 drugs selected for Medicare price negotiation hold 35.9% of 2024 spending ($103.6B). The top 10 drugs' share rose from 20.3% to 28.5%.
Limits
All figures are gross spending as CMS reports it, before manufacturer rebates, so the levels overstate what plans pay; the trends and shares are the useful signal.
Links
Built with AI coding tools from my brief. I wrote the brief, made the design calls, and checked every number on this page against the project's results files.